
Learn about the dashboards available in Status BI, how they can help you refine your compliance program, and how to export the data to use in external reports.
We have created a number of pre-built dashboards to help you visualize, export and manipulate your third party data.
Using the various filters, you can drill down into your dataset and either visualize in the platform, export the graphics for reporting, or for creating task lists.
The following are pre-built dashboards that will help you focus on specific areas of your compliance process:
- Third Party Life Cycle:
- Outlines the flow of how third parties are entered into Status, the services that have been ordered, the service status, and keeps track of follow up remediation actions. This also features a graph for service automation settings.
- Completed Cases:
- Gives a breakdown of the different services that have been completed by service type. The user can drill further into the information to review all of the completed services through the summary table.
- Outstanding Issues:
- Visualizes the total number of remediation activities that still outstanding by risk category and who's responsible. The user can drill further into the details by going to the third party's dashboard from the summary table.
- Business Case:
- This dashboard gives the user an understanding of the total amount of business case questionnaires that have been sent and their status. It also gives a break down of who internally submitted the questionnaire and which user had given their approval.
- Classification
- Illustrates total third parties in each classification, by risk type, and by geographic information.
- Change of classification can now trigger automated workflow/service orders
- Due Diligence:
- This dashboard allows the user to understand more about which third parties have, or have not, had due diligence completed. If the third parties have had due diligence completed, it allows the user to understand and drill into what type of due diligence was ordered, what types of risks were found, turn around times, and the volume of orders by time.
- Issue Tracker:
- Outlines all of the open and closed issues that were added to the issue tracker. It also gives a breakdown of how many issues are open/completed by the responsible person, turn around times, issues by category, and averages for total number of issues per third party.
- Monitoring :
- Gives insight into total amount of third parties being continuously screened/not screened, their status, and details around returned hits.
- Nature of Business :
- This dashboard gives insight into the total amount of all the different types of third parties that are in your Status platform. It will give an overview of each nature of business by risk and by geographic regions.
- Onboarding:
- Allows the user to better understand how many approvals are outstanding vs completed, and will let you know how many approvals are outstanding by the designated approver.
- Questionnaire:
- Visualizes the status of questionnaires, the breakdown of whether the questionnaires were submitted with risky VS non risky answers, turnaround times, how/who initiated the questionnaire, and details around any follow up questions asked to third parties in regards to unclear responses given in their questionnaire submission.
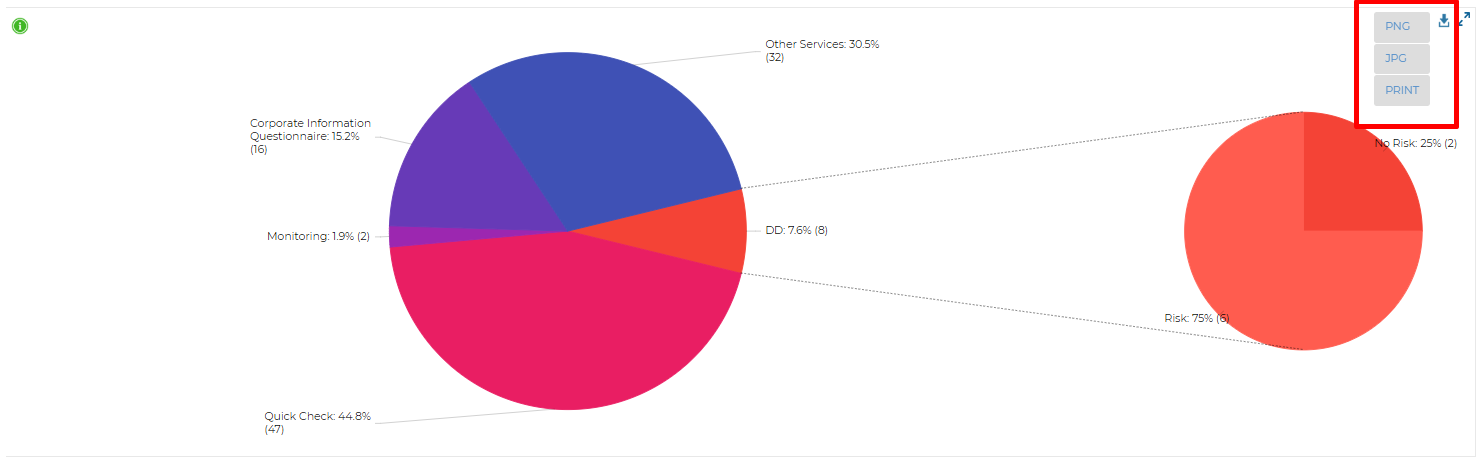
- Service Scope:
-
The service scope dashboard gives insight into all services order through the Status platform. It allows you to drill into geographic, risk, and service specific details that will help users with determine next steps to take in the compliance process.
-
- Icons:
- New dynamic icon will show if a service has been reviewed or pending a review.
- Filters
- A new dynamic filter has been added in graphs for users to easily view completed cases for presence or absence of hits/risks.
Exporting Data
Each visulization can be exported into JPG, PNG or can be sent directly to print.
To export the data into an excel file, first, you should adjust your Filters to ensure you are exporting the data you require.
To adjust your Filters, click the ![]() icon in the top right-hand corner when you're in the desired data-set.
icon in the top right-hand corner when you're in the desired data-set.
Use Case:
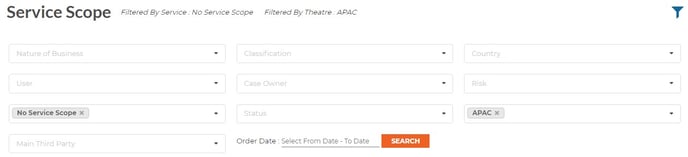
If for example, you would like to see how many of your Third Parties in the APAC region currently have not received any Due Diligence, using dataset 'Service Scope' you can follow the below steps to Filter these results:
First, from the drop-down 'Service Scope', select 'No Service Scope', next from the drop-down 'Theatre' select 'APAC'.
Ensure you have selected the correct dates & then hit 'Search'
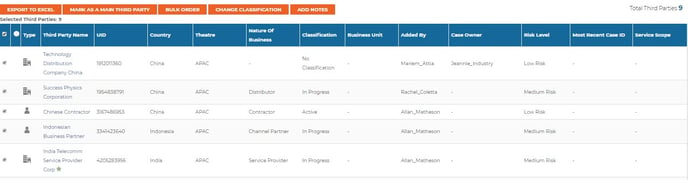
Scroll to the bottom of the screen where you will see a table with your filtered selections.
From here, you can select your desired Third Parties & can select an action from the following options:
Export to Excel
Bulk Order
Change Classification
Add Notes
Column Customization:
Compliance users can now customize the way columns are viewed to display/hide BI capabilities, similar to Third-Party Search.
If you have addition questions, or would like to organize a demo of Business Intelligence, please reach out to your designated client success managers.