Business Intelligence in Status allows you to:
- Understand the geographic composition of your third-party universe as it relates to risk level, classification, nature of business and more
- Break your third-party compliance activities down with analytics around internal users, services ordered and lifecycle management
- Easily export the graphs for use in presentations or reports and manipulate the data in Excel
To get started:
- Navigate to the 'Business Intelligence'menu the left hand side of the homepage:
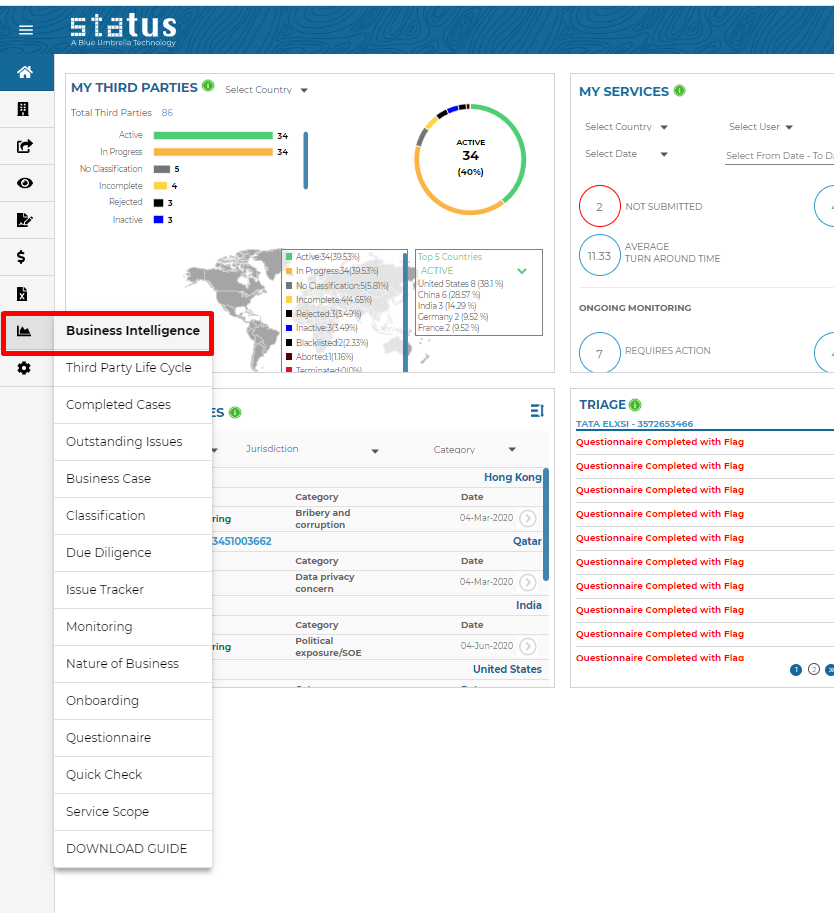
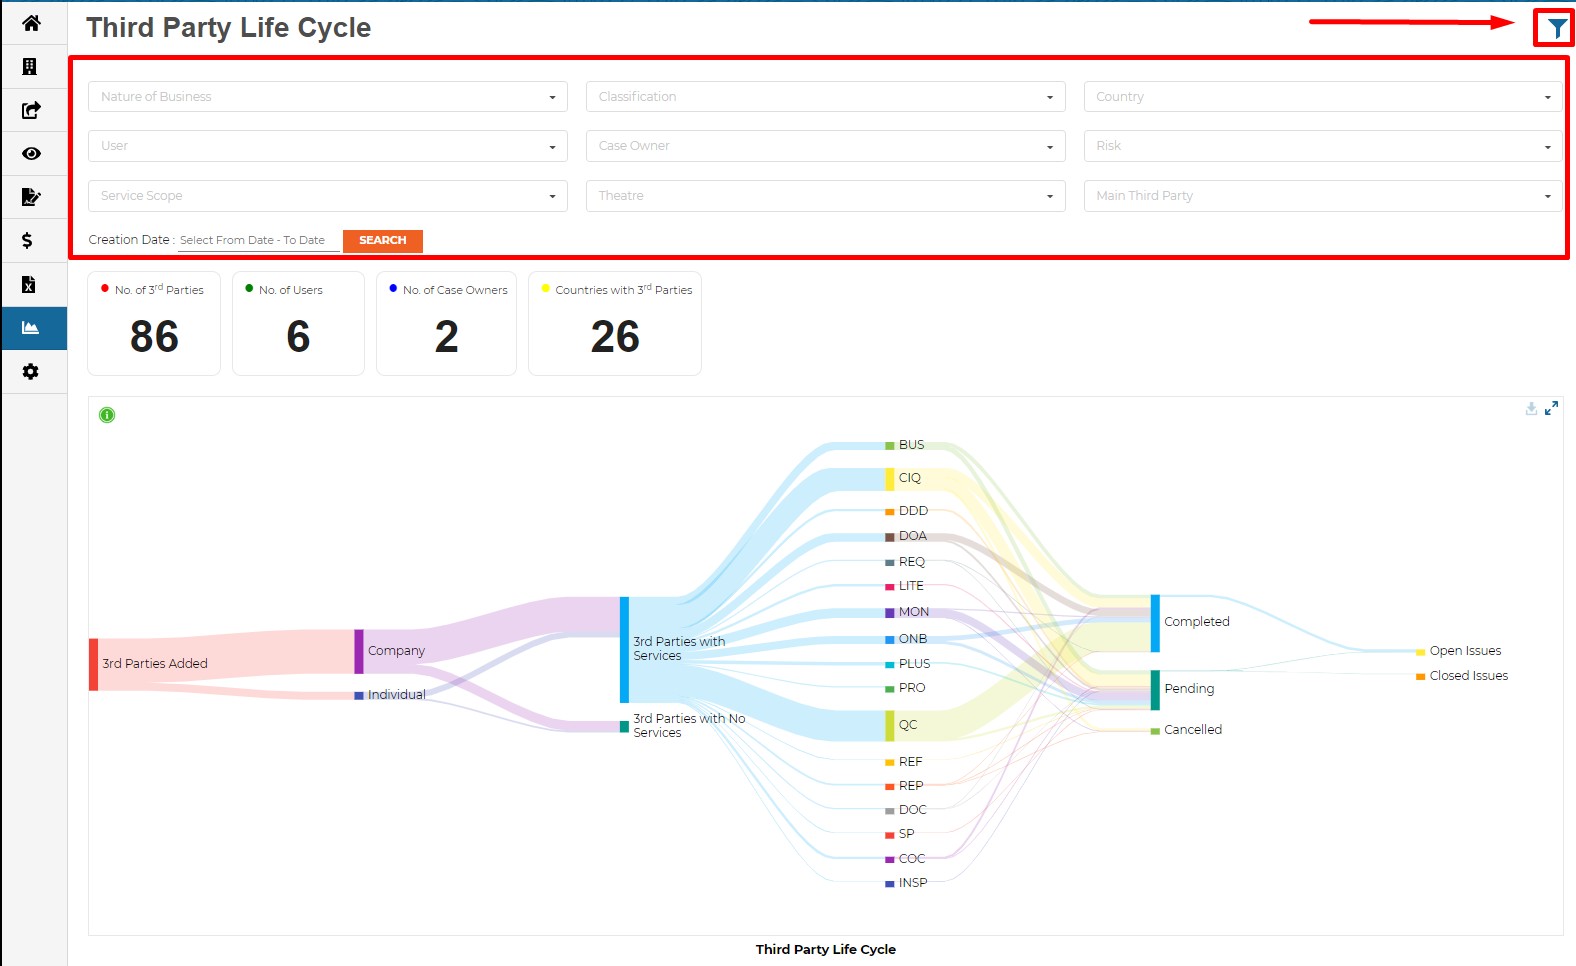
- Within the business intelligence menu, there are prebuilt dashboards which focus on different areas of your compliance program. Each dashboard is equipped with a series of visualizations, KPIs, and a summary table for you to better understand your program and to help you make insightful decisions.
- Use the filter icon in the top right corner to slice and dice the information
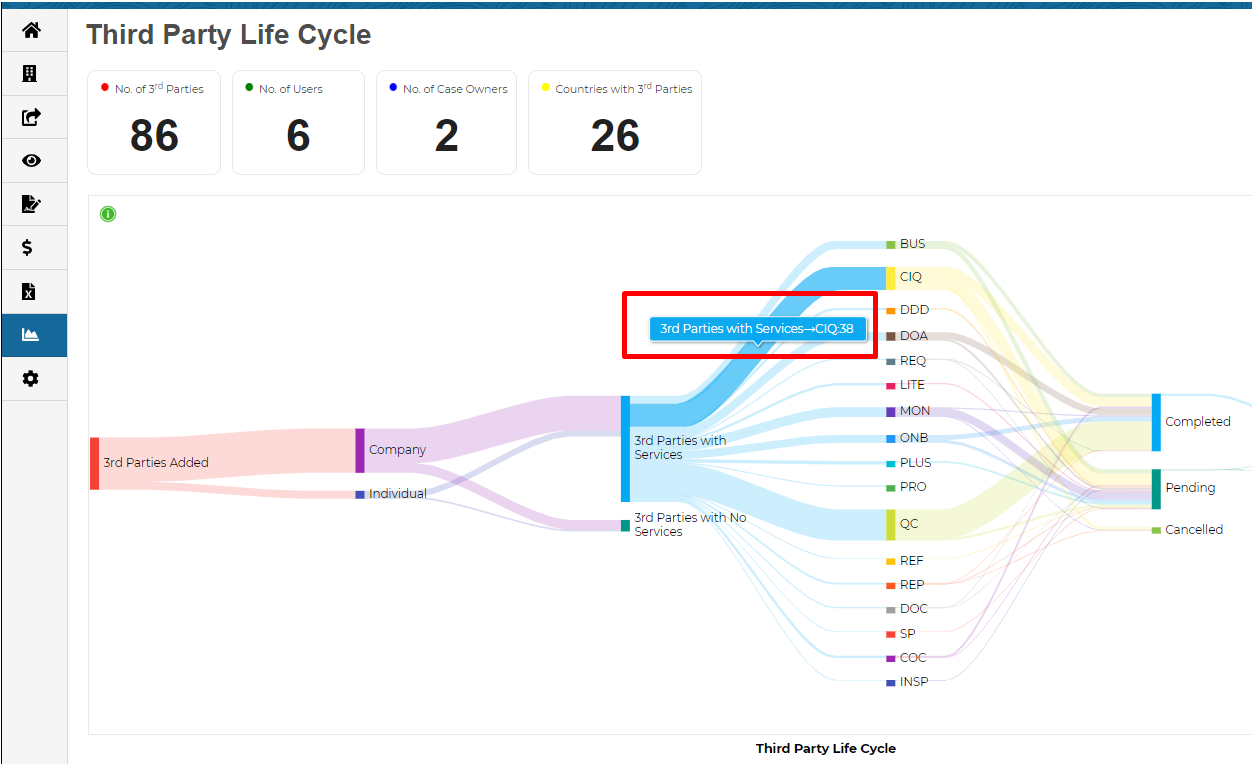
- Hover over any of the data in the renderings to get further insights:
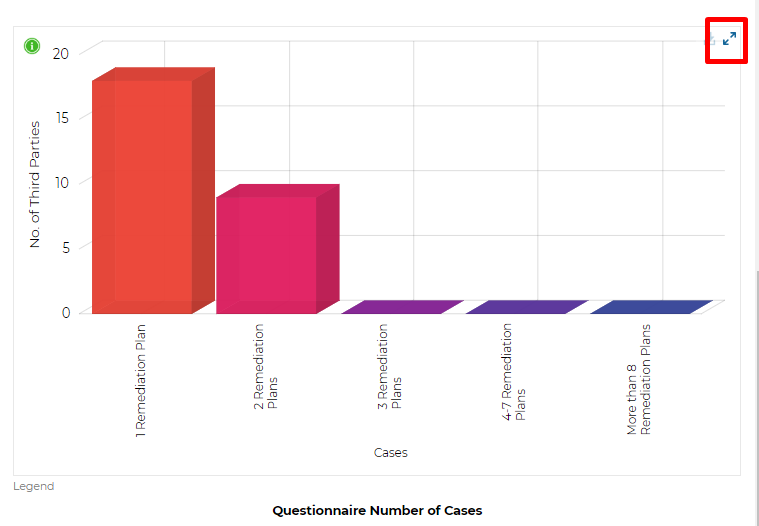
- Use the 'Expand' feature to extend the graphs to full-screen mode
For information on exporting the data from Business Intelligence, see Exporting Business Intelligence Data.
For any further information regarding accessing business intelligence, please reach out your Blue Umbrella client success manager.